🐝 Tjoskar's Blog
I write about stuff, mostly for myself
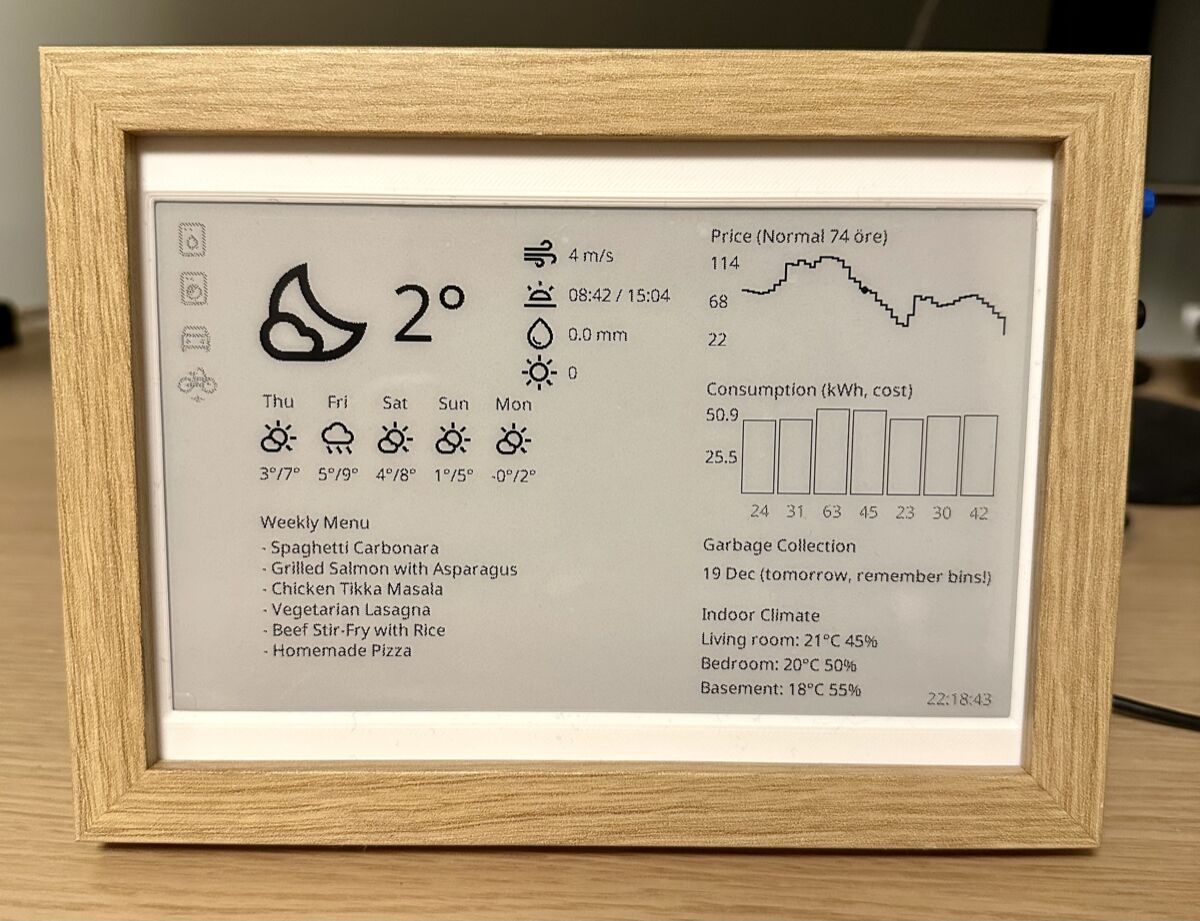
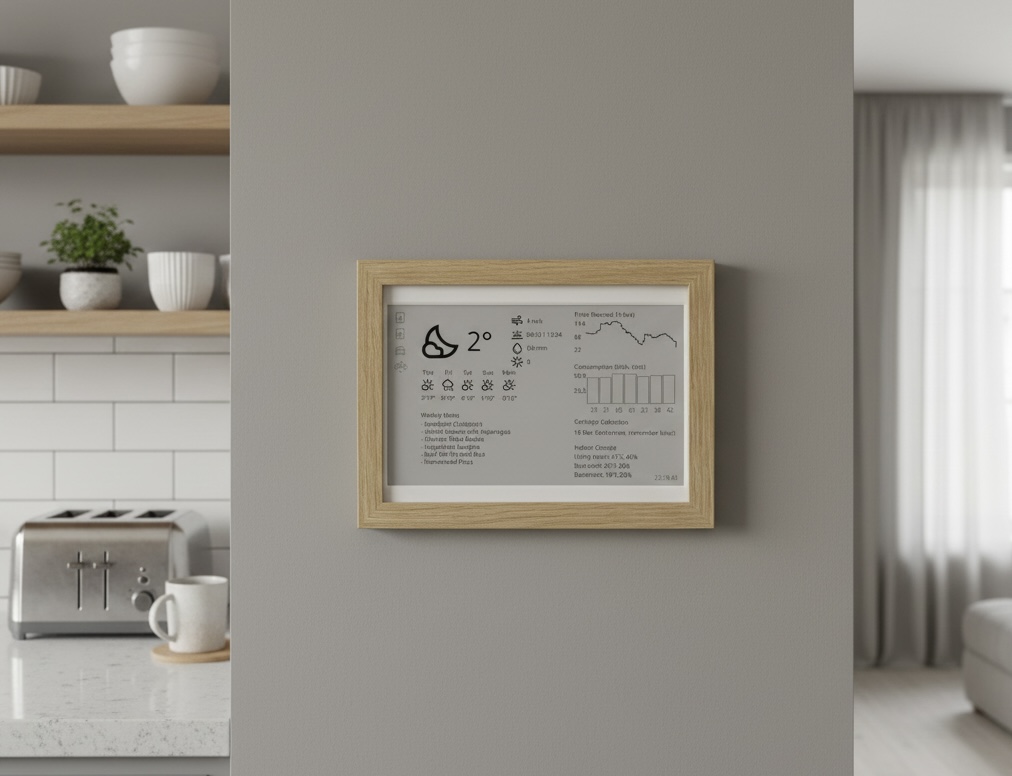
Use an E‑Ink display to show information about your house
The code for this project is open source: github.com/tjoskar/eink-pi-zero
I’ve written a step-by-step hardware guide that covers everything from soldering the buttons to configuring the Linux services. It’s the manual that should have come with the screen.
What I’ve used for this project:
- A Pi Zero W 2
- Waveshare 7.5” e-Paper HAT
- A IKEA frame
- Two physical buttons
- One LED
- Some solder and a few wires
I got this idea soon after we moved into our house and set up Home Assistant. I loved the data HA provides, but I disliked needing my phone every time I wanted to glance at energy use or toggle something. I wanted ambient, glanceable information in the kitchen. I also prefer the feeling of physical buttons over tapping on a screen. I didn’t want a bright LCD, E‑Ink felt more appropriate. At first I considered a color E‑Ink panel, but I couldn’t find any with a fast enough refresh rate (everything I looked at took ~40 s to redraw the screen).
When I started this project, I searched around and found a few home dashboards that used E‑Ink displays. Most of them followed the same pattern: spin up a browser (often headless Chrome), load a web page, take a screenshot, then pipe that bitmap to the E‑Ink controller. Clever, but heavy. The workflow looks like this:
- Event: a light turns on
- Headless Chrome process spins up
- Chrome loads a page
- Screenshot captured
- Script forwards image to controller
The latency can be up to a minute due to startup overhead, and error handling becomes complex.
I opted to render directly on the Pi Zero W 2. It takes just a few milliseconds to compose the image, then the display’s own refresh time dominates (~1 s). Simpler, faster, and fewer components to babysit.
I briefly considered a Pi Pico, but 264 KB RAM felt tight for image buffers and font rendering. The Pi Zero it is.
Setup
I flashed Raspberry Pi OS, enabled the SPI interface, and connected the display via the HAT.
The code is written in TypeScript using a JSX-based component model. Here’s what a minimal hello world looks like:
import { jsx } from "#lib";

export function App() {
  return (
    <view width={800} height={480} padding={40} background="white">
      <text size={48} weight="bold">Hello World!</text>
    </view>
  );
}
Check out the repo for the full setup instructions and more examples.
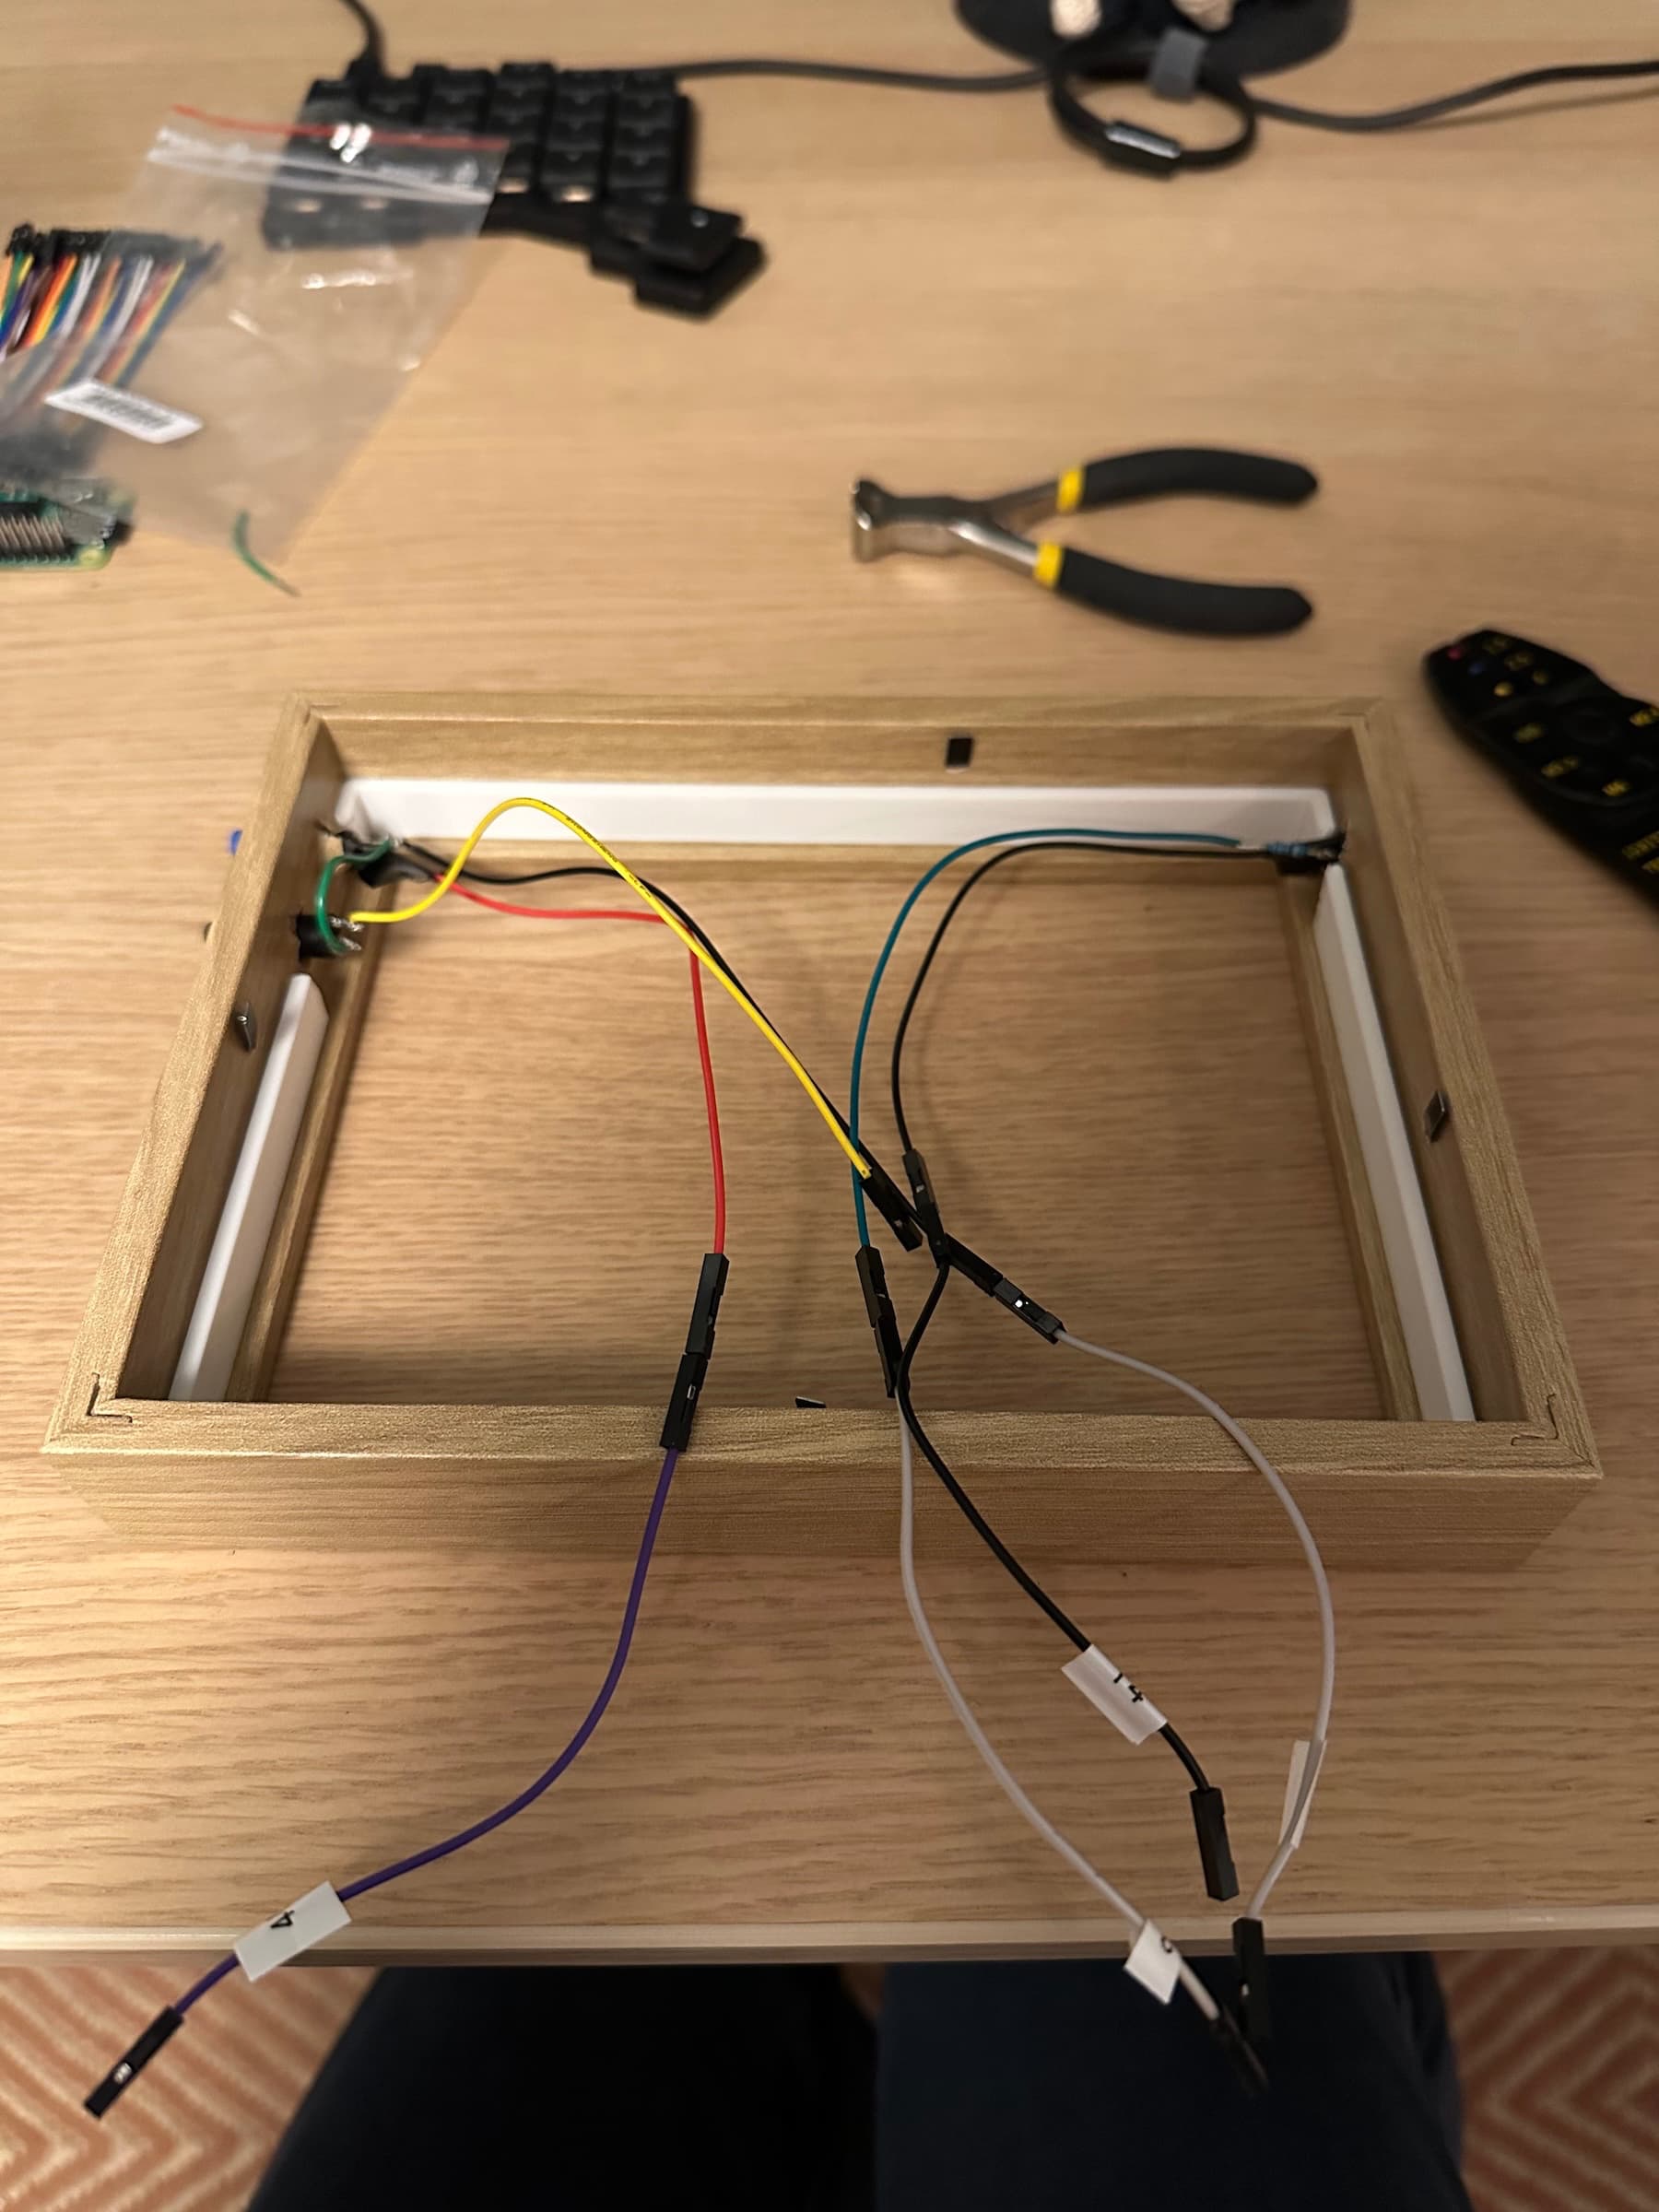
Set up the frame
I used a picture frame from IKEA and cut the mat a bit so it would fit.
Then I drilled three holes: two for the buttons and one for an LED. I soldered everything together and then connected it all.
I connected the button to GPIO 21 and ground.
I connected the LED to GPIO 13 and ground (just remember to add a suitable resistor so you don’t burn the LED).
Set up the application
I use an MQTT client to receive and send events to Home Assistant. When a device I care about (engine heater, bike charger, washing machine, dryer) turns on or off, an event is published that the program listens for. On receipt, I trigger a “fast render” (~1 s refresh including display time).
One button sends an MQTT event to HA to start the engine heater. This triggers a small dialog (“Starting the engine heater”) which auto‑dismisses after 5 s. When the heater is running (regardless of how it was started), the LED lights up. From across the room you can instantly tell the status. In summer I may repurpose it to show if the bike charger is active or just invent a new excuse for a tiny glowing light.
I fetch price and consumption data directly from my electricity provider (I love that they have a public GraphQL API for this).
Weather data comes from https://api.openweathermap.org
I also show upcoming garbage collection dates (hardcoded dates).
We plan meals in the iPhone Notes app. I eventually built a Shortcut that posts the meal list.
To upload the menu from your phone, you need an endpoint accessible on the internet. You could host a simple web server on your Raspberry Pi, but that requires exposing it to the internet (or only uploading when connected to your home Wi‑Fi).
A simpler alternative is to use a cloud function. For example, you can create a small Deno script using Deno KV storage. Deno Deploy is a fantastic service and easy to use. Here’s a sample script:
const kv = await Deno.openKv();

Deno.serve(async (req) => {
  if (req.method === "GET") {
    const entry = await kv.get(["menu"]);
    return new Response(JSON.stringify(entry.value || []), {
      headers: {
        "Content-Type": "application/json",
      },
    });
  }
  const body = await req.json();
  const content = (body.content as string).replace("Meal Plan\n\n", "");
  const firstSection = content.split("\n\n")[0];
  const lines = firstSection.split("\n");
  const list = lines
    .values()
    .filter((line) => !line.includes("- [x] "))
    .map((line) => line.replaceAll("- [ ] ", "").trim())
    .take(10)
    .toArray();

  const result = await kv.set(["menu"], list);

  return new Response(result.ok ? "OK" : "Error");
});
What I spent time on was making it possible to extract the data. The only workable way I found was to create a Shortcut that I run manually. It took a lot of trial and error to get it working.
Alternatives (like switching to a different notes app with an API) would mean convincing my partner to change apps (a harder engineering problem). I’ll probably try that at some point.
Want to build your own? The code is open source on GitHub. If you want a complete walkthrough of the hardware side — what to buy, how to wire it, how to solder buttons into the frame — I’ve written a short guide that covers all of it.
If you have any questions, any questions at all, just send me an email to hello@tjoskar.dev